01 / Research question and approach
This study examines two dimensions of a quotation: the distance between the best bid and ask, and the quantity displayed at each price. In the selected historical QNTUSDT perpetual-futures observations, what first-level quantities accompany a small spread? What do the two measures, read together, tell us about order direction and size?
We first measure spreads relative to the quotation midpoint, then compare the two sides against a common 1 QNT size benchmark. First-level quantity imbalance and last-to-mark price differences provide separate readings of quantity distribution and price context.
KEY OBSERVATIONS
Price distance and displayed size.
Best-quote distance relative to the quotation midpoint. The observation median is approximately 1.12 basis points.
Best-bid / best-ask counts among six readable observations. A buy is compared with ask quantity; a sell with bid quantity.
Bid minus ask quantity, divided by their sum. Similar ratios can accompany different total displayed quantities.
Observation date: 28 September 2026 · Seven selected, non-continuous historical records.
02 / Observation set and units
The sample contains seven selected, non-continuous historical quotation records dated 28 September 2026, identified as S01–S07. The retained time labels—2:00, 2:05, 2:07, 2:16, 2:19, 2:39 and 3:50—distinguish observations; they do not form an equally spaced time series. QNT is the underlying asset and USDT the quote currency. Prices are stated in USDT per QNT.
On a small screen, scroll the table horizontally. Keyboard: focus the table and use the arrow keys.
| ID / time label | Last / mark (USDT/QNT) | Bid / ask (USDT/QNT) |
|---|---|---|
| S01 / 2:00 | 266.99 / 267.20 | 267.15 / 267.18 |
| S02 / 2:05 | 269.66 / 269.78 | 269.66 / 269.69 |
| S03 / 2:07 | 268.38 / 267.89 | 268.33 / 268.35 |
| S04 / 2:16 | 271.72 / 271.96 | 271.61 / 271.66 |
| S05 / 2:19 | 269.04 / 269.39 | 269.01 / 269.09 |
| S06 / 2:39 | 285.31 / 286.06 | 285.30 / 285.37 |
| S07 / 3:50 | 268.83 / 268.66 | 268.81 / 268.84 |
Each record contains last price, mark price, best bid, best ask and readable first-level quantities. QNT is the quantity convention used in this study. S07 bid and ask quantities are unreadable, so those quantities and the associated imbalance remain missing rather than zero.
Midpoint and spread are calculated from the bid and ask within each record. Last and mark prices are separate fields: S01, for example, reports a last price of 266.99 and a best bid of 267.15. Refresh timing across fields is not aligned, so the values are not assumed to describe a single trade event.
Compare individual quotations7 observations
OBSERVATION DETAILS
Quotation and quantity
Select a record to inspect its quotation, quantity and derived measures. The time label identifies the observation; timing conventions are set out under method and scope.
Showing S01 · Time label 2:00
- Best bid / USDT per QNT
- 267.15
- Best ask / USDT per QNT
- 267.18
- Quoted spread / bps
- 1.12
- Bid size / QNT
- 0.1
- Ask size / QNT
- 1.0
- First-level quantity imbalance
- -0.818
Spreads are expressed in basis points; quantity imbalance is a dimensionless ratio. The analysis defines the variables and equations used here.
The first observation is shown here. The observation and liquidity tables contain all quotation and readable quantity records.
03 / Quoted spreads and displayed size
Let and denote the best bid and ask prices. The quotation midpoint is their average; the absolute spread is ask minus bid. Relative spread divides that price distance by the midpoint and expresses it in basis points. One basis point equals 0.01%.
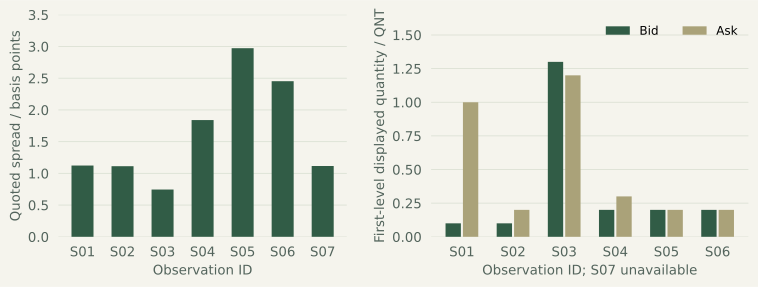
The seven relative spreads are approximately 1.12, 1.11, 0.75, 1.84, 2.97, 2.45 and 1.12 basis points. The range is 0.75–2.97 and the median approximately 1.12; the largest value is about four times the smallest. Figure 2 presents spread and first-level quantity separately, preserving their respective units.
Across six observations with readable quantities, best-bid size ranges from 0.1 to 1.3 QNT and best-ask size from 0.2 to 1.2 QNT. Five bids and four asks display less than the common 1 QNT benchmark. An aggressive buy is compared with ask quantity; an aggressive sell with bid quantity.
S03 has a relative spread of approximately 0.75 basis points and displays 1.3 QNT at the bid and 1.2 QNT at the ask. S01 has a spread of approximately 1.12 basis points, but displays only 0.1 QNT at the bid and 1.0 QNT at the ask. Both have small price distances, yet offer different first-level quantities for an order of a given size and direction. Quotation comparisons therefore need spread, direction and corresponding quantity together.
The 1 QNT benchmark standardizes the size comparison; it is not an executed order. For sizes beyond the first displayed level, execution-cost analysis also needs deeper prices, cancellations, replenishment, hidden quantity and fees.
04 / First-level quantity imbalance
Let and denote displayed best-bid and best-ask quantities in QNT. When their sum is positive, static first-level quantity imbalance is defined below. This dimensionless measure lies between −1 and 1: positive values indicate more quantity at the bid, negative values more at the ask, and zero equal quantities.
On a small screen, scroll the table horizontally. Keyboard: focus the table and use the arrow keys.
| Observation | Bid / ask quantity (QNT) | Top-level I |
|---|---|---|
| S01 | 0.1 / 1.0 | -81.82% |
| S02 | 0.1 / 0.2 | -33.33% |
| S03 | 1.3 / 1.2 | +4.00% |
| S04 | 0.2 / 0.3 | -20.00% |
| S05 | 0.2 / 0.2 | +0.00% |
| S06 | 0.2 / 0.2 | +0.00% |
S01 has an imbalance of −81.82%, corresponding to 0.1 QNT at the bid and 1.0 QNT at the ask. S03 is +4.00%, with 1.3 and 1.2 QNT respectively. S05 and S06 each display 0.2 QNT on both sides, giving zero imbalance. Percentages in the table are the ratio multiplied by 100 and describe relative quantity distribution.
Imbalance should be read alongside quantity. S05 and S06 both have zero imbalance, but display only 0.2 QNT per side. S03 is also close to balanced, yet displays more than 1 QNT per side. Similar imbalance readings therefore need not imply similar displayed size.
Order-flow imbalance (OFI) measures changes in quotes and quantities across events, including submissions, trades and cancellations; the study by Cont, Kukanov and Stoikov uses that event-based measure.[3] This study calculates a single-observation quantity ratio, not an event-flow measure or a probability of future price direction.
05 / Price context across observations
The seven last prices range from 266.99 to 285.31 USDT per QNT. Figure 1 orders them by observation ID to align with the quotation and quantity records. The horizontal axis represents observation order; spacing does not represent elapsed time.
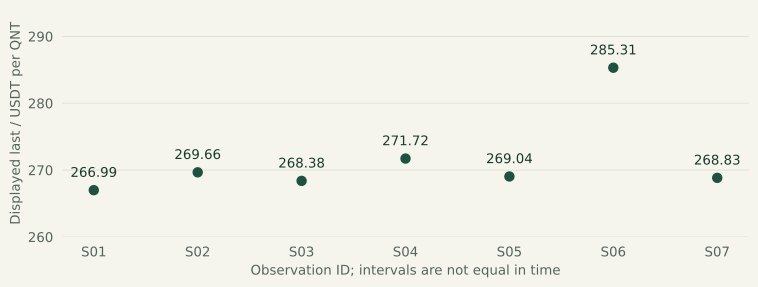
S06 has a last price of 285.31 and S07 a last price of 268.83, approximately 5.78% lower. This two-observation comparison supplies price context. The non-continuous sample does not establish intervening highs, lows or a complete path, so the change is not treated as a period maximum-drawdown or volatility estimate.
06 / Last-to-mark price comparison
Last price records the most recent trade; mark price is a separate reference used in perpetual-contract valuation and risk control. Exchange documentation explains the related liquidation mechanism.[1] Their relative difference is reported separately to add quotation context.
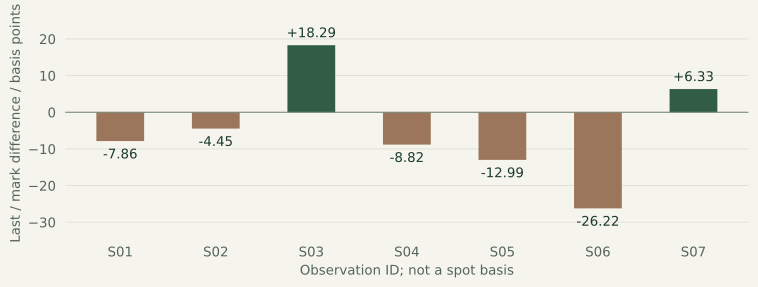
The relative difference uses mark price as the denominator and is expressed in basis points. It ranges from −26.22 to +18.29 across the seven records. S06 has a last price of 285.31 and a mark price of 286.06, giving approximately −26.22 basis points.
Figure 3 shows the magnitude and direction of each difference. Field refresh timing is not aligned, so the calculation compares recorded values. Perpetual-to-spot basis analysis would also require synchronized spot or index prices, which are not present in this sample.
07 / Assessment and further measurement
Relative spreads in this sample are all below 3 basis points, while first-level quantities vary. S03 displays more than 1 QNT on both sides; each of the other five readable observations has at least one side below that size. For the research question, spread supplies the price dimension and quantity the size dimension. Together they describe quotation conditions for an order of a specified direction and size.
Quantity imbalance provides a further distinction: observations that are close to balanced can still have different total displayed size. Last and mark prices add another form of price context and do not replace the bid–ask spread. These measures retain separate meanings rather than forming a single liquidity verdict.
Further measurement should prioritize continuous, time-aligned records. Predefined observation windows would retain depth snapshots, incremental updates, sequence IDs, exchange timestamps and receipt times, with continuity checks.[2] This would support analysis of spread distributions, quantity within price bands, replenishment and execution conditions for specified sizes.
08 / Method and scope
Sample and timing: this edition retains seven selected, non-continuous historical observations without additional or interpolated records. Time labels retain their original form; timezones are not standardized and labels are not validated exchange-event times. Fields may refresh asynchronously. IDs align records and figures; charts do not interpolate elapsed time. First-level quantities use a QNT convention that has not been independently reconciled to contract specifications. S07 quantities and associated calculations remain missing.
Calculation and scope: spread uses the bid, ask and midpoint within each record. Quantity imbalance is calculated only when both quantities are readable and their sum is positive. The observation median is not time weighted and does not estimate typical liquidity over a complete period. Analysis covers recorded spreads, first-level displayed quantities and price-field comparisons; it does not include full depth, hidden quantity, event flow or actual execution outcomes. This historical-sample study is not investment advice.
References
These references provide background on liquidation mechanics, order-book reconstruction and event-based order-flow measurement. They support the definitions and further-measurement framework used in this study.