01 / Why we are following IALT
IALT has recently become a subject of interest in Unique Aurora’s research. The attraction is a concrete question: how can security selection, macro views and directional exposures be combined in a public ETF, and how much of that construction can an outside reader assess?
Our present view is to follow the fund and examine its mechanics while waiting for a longer record across different market conditions. The strategy design is already open to analysis; the durability of its results requires more evidence. A larger asset base or a strong opening period cannot substitute for that evidence.
This report studies publicly disclosed information. It is not investment advice, a recommendation to buy or sell, or a statement of Unique Aurora’s holdings. The analysis is Unique Aurora’s; fund terms should be read in the issuer’s original documents.
02 / Fund profile and mandate
The iShares Systematic Alternatives Active ETF (IALT) is actively managed and multi-asset. It began on 9 December 2025; its stated comparator is the ICE BofA 3-Month U.S. Treasury Bill Index. [1]
Nasdaq’s listing announcement specifies 10 December 2025 as the first listing date. Fund inception and exchange listing are separate events. [7]
The August 2026 summary prospectus states a long-term total-return objective and annual operating expenses of 0.99%. It permits long and short exposures and derivatives. Indirect cryptocurrency exposure is permitted, with an intended aggregate net-notional cap of 5% of net assets; investment in the Cayman subsidiary is limited to 25% of total assets, including leverage. [2]
These permissions outline the investment universe. Actual portfolio weights need a dated holdings disclosure and a defined exposure measure. The remainder of this report examines the multi-strategy construction.
03 / Where returns are intended to come from
BlackRock’s July 2026 explanation organizes IALT around three approaches: security selection using market-neutral stock comparisons; dynamic macro using cross-asset models and trend information; and directional allocation that varies market exposure. These are the issuer’s descriptions of the intended process, not a verified attribution of realized returns. [3]
On a small screen, scroll the table horizontally. Keyboard: focus the table and use the arrow keys.
| Approach | Question to investigate | Evidence to seek |
|---|---|---|
| Security selection | Do relative security views add value after common factor exposures and implementation costs? | Long/short exposures, factor sensitivities, turnover and attribution. |
| Dynamic macro | How do models respond when rates, currencies and commodities change direction? | Exposure changes, reversal losses and the timing of risk adjustments. |
| Directional allocation | How much of the outcome depends on favorable broad-market moves? | Conditional equity, credit and rate sensitivities in both rising and falling markets. |
The last approach matters when interpreting the whole fund. A market-neutral component can coexist with directional risk elsewhere. We would assess the combined portfolio from its behavior and exposures, rather than applying one component’s label to the entire ETF.
For us, the central modeling question is how these approaches interact. Different signal names do not establish independent risks. Their relationship during funding pressure, rapid reversals or liquidity contraction would be more informative than their relationship during a calm period.
Our attribution framework would distinguish income on collateral, changes in the value of risky positions and implementation costs. Only then would we ask which investment approach contributed. A positive fund return alone cannot identify whether security comparisons, market direction or collateral income was the dominant driver.
04 / Reading the portfolio: value, exposure and risk
At 8 October 2026, issuer market-value categories were equity 31.47%, fixed income 13.13%, alternatives 0.02%, and cash and/or derivatives 55.38%. [1]
A strategy can require cash collateral while carrying substantial risk through derivatives. Therefore, the combined cash-and-derivatives category cannot be interpreted as an uninvested cash balance, nor can the small “alternatives” category measure the extent of alternative strategies.
On a small screen, scroll the table horizontally. Keyboard: focus the table and use the arrow keys.
| Instrument | Market value | Notional value |
|---|---|---|
| S&P 500 E-mini futures, December 2026 | 0.00 | 1,395.50 |
| iTraxx Europe series 46 credit-default swap | 71.93 | 4,130.67 |
These examples come from the issuer’s holdings file dated 9 October 2026. They illustrate the distinction between market value and notional value; neither figure is a direct estimate of potential loss or a strategy’s risk budget. [4]
For position analysis we separate three views: market value for valuation; signed economic exposure for direction; and gross exposure for the scale of positions before offsetting. The relevant sensitivity then depends on the instrument: equity beta, rate duration, credit-spread sensitivity, currency exposure or option sensitivities.
The following is a simplified example for comparable equity exposures in one currency. Let be portfolio net assets and a signed exposure amount. is net exposure and is gross exposure, each normalized by .
For a hypothetical portfolio with , a long exposure of 90 and a short exposure of 85 produce and . Small net exposure still leaves exposure to relative price changes, financing and an imperfect hedge. This is a teaching example, not an IALT exposure calculation. Summing unlike derivative notionals would not produce a comparable risk measure.
05 / Historical disclosures and related experience
The first annual shareholder report covers 9 December 2025–30 April 2026. Its portfolio table is labeled as percentages of notional amount: equity swaps account for 34.3% and foreign-exchange forwards for 22.7%. The report also records portfolio turnover of 181% for that initial period. [5]
That is a different date and denominator from the October market-value breakdown. A table totaling 100% of notional composition is not a claim that gross exposure equals 100% of net assets. Neither table, by itself, assigns exposures to the three investment approaches or establishes their contributions to returns.
BlackRock’s product brief places IALT alongside BDMIX, the BlackRock Global Equity Market Neutral Fund, to explain the team’s background. BDMIX is a separate mutual fund; IALT uses a new multi-strategy ETF structure. [6]
Related experience is useful context for questions about research discipline and implementation. It does not extend IALT’s own return history. Differences in mandates, instruments, allocation rules, expenses and fund flows can change the outcome even when some expertise is shared.
06 / Early performance and measurement dates
Period returns provide a first view of realized performance. They also show why the valuation basis matters: NAV total return measures changes in the fund’s per-share value with distributions reinvested, while market-price total return uses ETF share prices. Neither is an individual investor’s execution result.
On a small screen, scroll the table horizontally. Keyboard: focus the table and use the arrow keys.
| Measurement period | NAV total return | Market-price total return | Cash benchmark |
|---|---|---|---|
| June 2026 | −0.78% | −0.22% | +0.29% |
| Quarter ended 30 June 2026 | +3.42% | +3.15% | +0.89% |
| Inception–30 June 2026 | +12.16% | +12.66% | +1.98% |
| Inception–30 September 2026 | +19.32% | +19.93% | +2.89% |
The June figures come from the fact sheet dated 30 June; the September figures come from the product page’s period-performance table. The cash benchmark is the stated ICE BofA 3-Month U.S. Treasury Bill Index. In June, NAV return was 1.07 percentage points below that benchmark, despite a positive return over the quarter. A favorable longer interval can therefore contain a distinct loss episode. [8] [1]
For daily analysis, we use 210 NAV observations from 9 December 2025 to 9 October 2026, giving 209 return intervals. NAV rose from USD 25.00 to USD 29.93. With the two disclosed distributions reinvested at ex-date NAV, our calculated cumulative total return is 20.22%; without distribution adjustment, the NAV change is 19.73%. These October calculations have a later endpoint than the issuer’s September table above. [10]
07 / The June drawdown and recovery
The largest drawdown in this daily NAV total-return sample occurred between 4 and 26 June 2026. The index fell 2.28% from its prior peak and first regained that peak on 21 July. The full peak-to-recovery interval was 47 calendar days, or 31 observed daily intervals. This describes an episode in the available history; it is not a bound on future losses. [10]
On a small screen, scroll the table horizontally. Keyboard: focus the table and use the arrow keys.
| Measure | Result | Interpretation |
|---|---|---|
| Prior peak | 2026-06-04 | NAV USD 28.56; distribution-adjusted index peak |
| Trough | 2026-06-26 | NAV USD 27.83; total-return drawdown −2.28% |
| Unadjusted NAV drawdown | −2.56% | Same peak and trough dates; includes the ex-dividend reduction |
| Worst daily NAV return | 2026-06-05 / −1.56% | A one-interval loss, distinct from the cumulative drawdown |
| Recovery of the prior peak | 2026-07-21 | First subsequent observed total-return level at or above the peak |
A total distribution of USD 0.079121 per share went ex-dividend on 15 June, inside this window. Unadjusted NAV therefore combines portfolio valuation changes with the distribution deduction. Reinvestment reduces the measured maximum drawdown from 2.56% to 2.28%. Our calculations retain the six-decimal NAV observations; the NAV amounts displayed in the table are rounded to cents. [1] [10]
The index had already reached an almost equally deep low on 10 June, before a partial recovery and a second decline. Both lows round to a 2.28% drawdown; 26 June is the lower observation at the original NAV precision. [10]
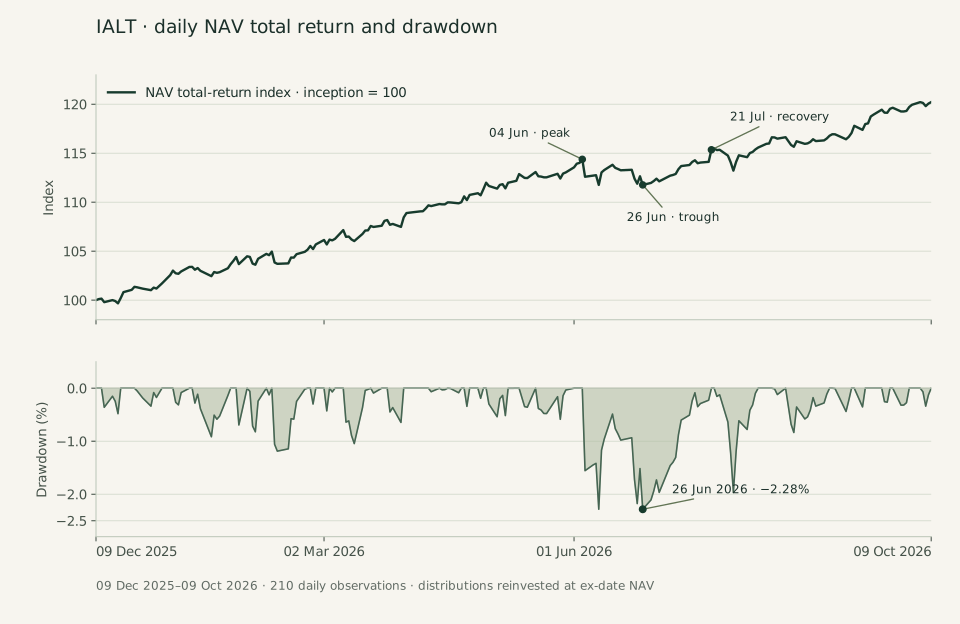
Depth, duration and the worst individual day answer different questions. Here, the worst daily change preceded the trough by three weeks. A month-end return alone would not show the decline from the earlier peak or the time required to regain it. A longer record will allow comparison of these features across several independent episodes.
08 / Market conditions on two key dates
We examine the worst daily observation and the eventual trough separately. The following background uses information released or recorded on the relevant dates. It describes market conditions alongside the NAV changes; establishing the fund’s actual drivers would require contemporaneous position sensitivities and return attribution.
On a small screen, scroll the table horizontally. Keyboard: focus the table and use the arrow keys.
| Date | Daily NAV return | VIX close |
|---|---|---|
| 2026-06-05 | −1.56% | 21.51 |
| 2026-06-26 | −0.78% | 18.41 |
On 5 June, the initial U.S. employment release reported 172,000 additional nonfarm payroll jobs in May and unemployment of 4.3%. The 2-year Treasury par yield rose from 4.05% to 4.17%, and the 10-year yield from 4.47% to 4.55%, relative to 4 June. VIX rose from 15.40 to 21.51. IALT’s NAV fell 1.56% that day, alongside higher Treasury yields and S&P 500 index-option-implied volatility. [11] [12] [13] [10]
On 26 June, IALT’s NAV declined 0.78% and the total-return index reached the window’s trough. VIX closed at 18.41, below its 5 June level. The June Russell index reconstitution became effective after that close; Nasdaq reported approximately USD 334.027 billion across its Closing Cross. This is market-wide auction activity, not IALT turnover or evidence that IALT rebalanced with the index. [10] [13] [14] [15]
The two dates illustrate why cumulative losses and a single-day volatility indicator should be read separately. Research into the episode would next ask how equity, rates, credit, currencies and collateral contributed, and whether several strategies shared a common sensitivity. Public daily NAV supports the timing and magnitude of the loss; it does not resolve those contribution questions.
09 / Costs and implementation
The stated operating-expense ratio is only one part of the economic question. An assessment of implementation would also examine trading, financing, hedging and the cost of maintaining derivatives, alongside the costs of buying or selling ETF shares. We do not estimate those additional costs from a single holdings file.
A useful review would keep fund returns separate from an investor’s execution result: the entry price, bid–ask spread, premium or discount to net asset value and timing of the trade all affect the latter. A fund can be exchange traded while the liquidity of its underlying instruments varies substantially under stress.
We would pay particular attention to the combination of leverage and changing liquidity. A modest valuation change may lead to collateral demands; offsets that look effective in ordinary conditions may become expensive to maintain. The research task is to understand those interactions, rather than infer safety from the ETF label.
10 / The evidence we want across market conditions
As of this report’s publication, IALT has less than one year of operating history. We would not annualize an opening-period return or present it as evidence of durable risk-adjusted performance. Waiting for a longer record means observing different conditions, not merely reaching a calendar anniversary.
On a small screen, scroll the table horizontally. Keyboard: focus the table and use the arrow keys.
| Condition | What to examine | Evidence that would add confidence |
|---|---|---|
| Broad equity or credit decline | Conditional market sensitivity, drawdown and recovery. | Several independent episodes with consistent data and an explained exposure path. |
| Abrupt trend reversal | Changes in macro positioning and losses during adjustment. | Disclosures that distinguish systematic response from a favorable market rebound. |
| Funding or liquidity pressure | Collateral, trading conditions and the relationship between ETF price and NAV. | A documented response during stress, rather than a quiet-period average. |
| Changing correlations | Whether several approaches lose together and why. | Exposure and attribution information sufficient to identify common drivers. |
For future updates, our preference is a consistent total-return series, dated exposure snapshots and explanations of material allocation changes. Short samples can make correlation and risk-adjusted ratios unstable. We would report the measurement interval and uncertainty rather than convert a limited sample into a strong long-term claim.
11 / Present assessment
IALT is worth following as an observable implementation of systematic alternatives inside an ETF. Our interest lies in how research signals become positions, how different strategies share risk, and how that construction behaves when markets change.
The daily record now identifies an early drawdown episode: a 2.28% decline in the reinvested-NAV index, followed by recovery of its prior peak 47 calendar days after that peak. The depth and recovery are useful observations, but the short record has not yet covered enough independent market conditions to assess durability. Our present stance remains continued research and observation across cycles.
12 / Method and scope
Research date: 12 October 2026. Strategy descriptions and published period returns are attributed to the issuer. The daily return calculations, exposure example and research judgments are Unique Aurora’s analysis. The analysis does not reconstruct proprietary signals, internal strategy weights or a complete risk model.
Daily NAV and distributions use daggerok/iShares’ public transcription of the issuer workbook, fixed to the revision linked below. We checked nine NAV and return anchors against issuer disclosures, including the first financial statements, the June fact sheet and the September performance table, and checked both distributions. This verifies agreement at the published precision; it is not a direct check of every row against the original workbook. [10] [9] [8] [1]
Let denote daily NAV per share and the distribution per share on its ex-dividend date, with otherwise. The series includes USD 0.034281 on 30 December 2025 and USD 0.079121 on 15 June 2026. We compute daily total return and compound an index from an inception level of 100: [1]
This is an analytical convention that reinvests gross distributions at ex-date NAV. Fund expenses are already reflected in NAV. Personal taxes, commissions and entry or exit spreads are excluded. We retain the original NAV precision, do not interpolate non-observation dates, and do not annualize the resulting returns.
Drawdown is the signed change from the index’s running peak. The sample maximum drawdown is its most negative value; recovery is the first later daily observation at or above the episode’s prior peak:
The window is fund inception through 9 October 2026 and includes the inception observation one day before exchange listing. It measures daily NAV drawdown, rather than intraday losses or ETF market-price drawdown. Same-day macroeconomic information is contextual evidence; an attribution to a particular IALT strategy requires additional position and contribution data.
The issuer distinguishes vendor-price holding values from fund NAV valuations. Exact reconciliation to net assets cannot be assumed. [1]
Market-value categories, notional composition and selected position amounts use their own disclosed dates and denominators. We do not add those measures together.
The June fact sheet defines its holdings count to exclude cash and derivatives such as futures and currency forwards. A count is therefore sensitive to disclosure conventions and is not a measure of independent positions, independent signals or diversification. [8]
For full holdings and governing terms, consult the original sources. The dates recorded here identify the disclosures used for this edition; issuer links may subsequently show newer material.
Source material and references
- iShares · IALT product page
Product and holdings statistics: 9 October 2026; asset-class breakdown: 8 October 2026.
- BlackRock ETF Trust · IALT summary prospectus, SEC filing
Dated 24 August 2026. Governing disclosures take precedence over product summaries.
- BlackRock Systematic Investing · Unlocking alternatives in active ETFs
Issuer strategy explanation, 13 July 2026.
- iShares · Latest IALT holdings CSV
Examples read from the file dated 9 October 2026. This link advances with subsequent disclosures.
- iShares · IALT annual shareholder report
First reporting period: 9 December 2025–30 April 2026.
- BlackRock · IALT product brief
Edition reviewed includes data through 30 June 2026 and marketing reference MKTG0726-5777549.
- Nasdaq · New ETP listing announcement, IALT
Announcement: 9 December 2025; first listing date: 10 December 2025.
- iShares · IALT fund fact sheet
Dated 30 June 2026; period returns and the holdings-count definition. Allocation data in this edition are historical.
- BlackRock ETF Trust · Annual financial statements, IALT financial highlights
Page 119; 9 December 2025–30 April 2026. Opening and closing NAV and non-annualized total return.
- daggerok/iShares · IALT daily NAV and distributions, fixed revision
Public transcription of issuer-workbook data, revision 52a0d5befe05, 11 October 2026. Analysis uses 9 December 2025–9 October 2026; calculations by Unique Aurora.
- U.S. Bureau of Labor Statistics · Employment Situation, May 2026
Initial release, 5 June 2026, 08:30 Eastern Time; figures describe the information available that day.
- U.S. Treasury · Daily Treasury par yield curve rates, June 2026
Daily 2-year and 10-year par yields, 4–5 June 2026.
- Cboe · VIX historical data
Daily closing observations for 4, 5 and 26 June 2026; VIX measures S&P 500 index-option-implied volatility.
- FTSE Russell · Russell Reconstitution 2026 schedule
June reconstitution effective after the close on 26 June; new membership effective from the open on 29 June 2026.
- Nasdaq · June 2026 Russell reconstitution Closing Cross
26 June 2026: approximately USD 334.027 billion in the Nasdaq Closing Cross across securities; not IALT trading volume.